1 Introduction
Welcome to the orientation learning module for PSYC 2530. We will cover everything here and more on the first day of class. See you there.
Goals
- General course orientation
- get you ready for the first week
Read
Read the syllabus for this course.
Getting started goals
There are many possibilities for technical difficulties as we get started. The computer room is equipped with the software that we need, however, I strongly encourage you to install the necessary software on your own computer.
Throughout the semester we will be using software called R, Rstudio, quarto, and github. All of this software is free and open-source, and can be installed on windows, mac, or linux.
Over the semester, you will be using these tools to build a personal course blog and website. Every week will involve blogging assignments, and there are slightly more involved midterm and final projects.
Please follow these instructions to create a quarto blog. Don’t worry if you can’t get it to work, we will troubleshoot in class.
Quarto blog instructions
This is a blog post I made (on my own quarto blog), about how to get started blogging with quarto.
Week 1 assignment
- Once you have created your quarto blog, please submit the url to your blog on blackboard (to the week 0 assignment.)
More Goals for Week 1
We have two more introductory week classes. In these two classes we have a few goals to keep us busy.
Get an overall sense of what we can do with the data-analysis and data visualization software we are using in the class.
Solve technical problems associated with the first assignment (getting R, R Studio, Github Desktop, and your Quarto blog working.)
Get some basic understanding of the workflow we will be using, make sure it works, and start getting into the learning process.
Throughout the first week I will be updating this page as well as the compendium with material as we go.
Data science in a box
There are many great free resources on the web for learning data skills with R. This example comes from data science in a box.
This whole course is built using quarto, the same tool we will use for our blogs.
There are different approaches to learning R from scratch. One approach is start with all of the fundamental building blocks of coding, and then slowly move into much higher level tasks for data analysis, like learning how to use functions for data-visualization. Another approach is to begin with a hands-on example of using R for reproducible data-analysis and visualization.
NOTE: “Reproducible” is an important concept we will emphasize throughout the course. For now a “reproducible” analysis means that other people can re-do the same analysis that you did and get the same results.
In class we will look at the “First dataviz” example from the hello world section:
https://datasciencebox.org/02-hello-world.html
Instructions
GOAL: Our big goal here is to reproduce the data-visualization from this example on our own computer using R Studio, and then talk about what we are looking at.
- Open Rstudio
- Make a new project
- Under the file menu, select “New project”, or click the top-right corner of R studio (with the blue R cube), and choose New Project.
- IMPORTANT: You should almost always be working inside an R studio project. We will talk more about this in class.
- Choose “New Directory”
- Choose “New Project”
- Create a name, and choose where to save it, e.g. “datavis1”
- Click “Create project”
- You can confirm you are now in an R studio project by looking at the top right hand corner, you should see a blue cube with the name of your project.
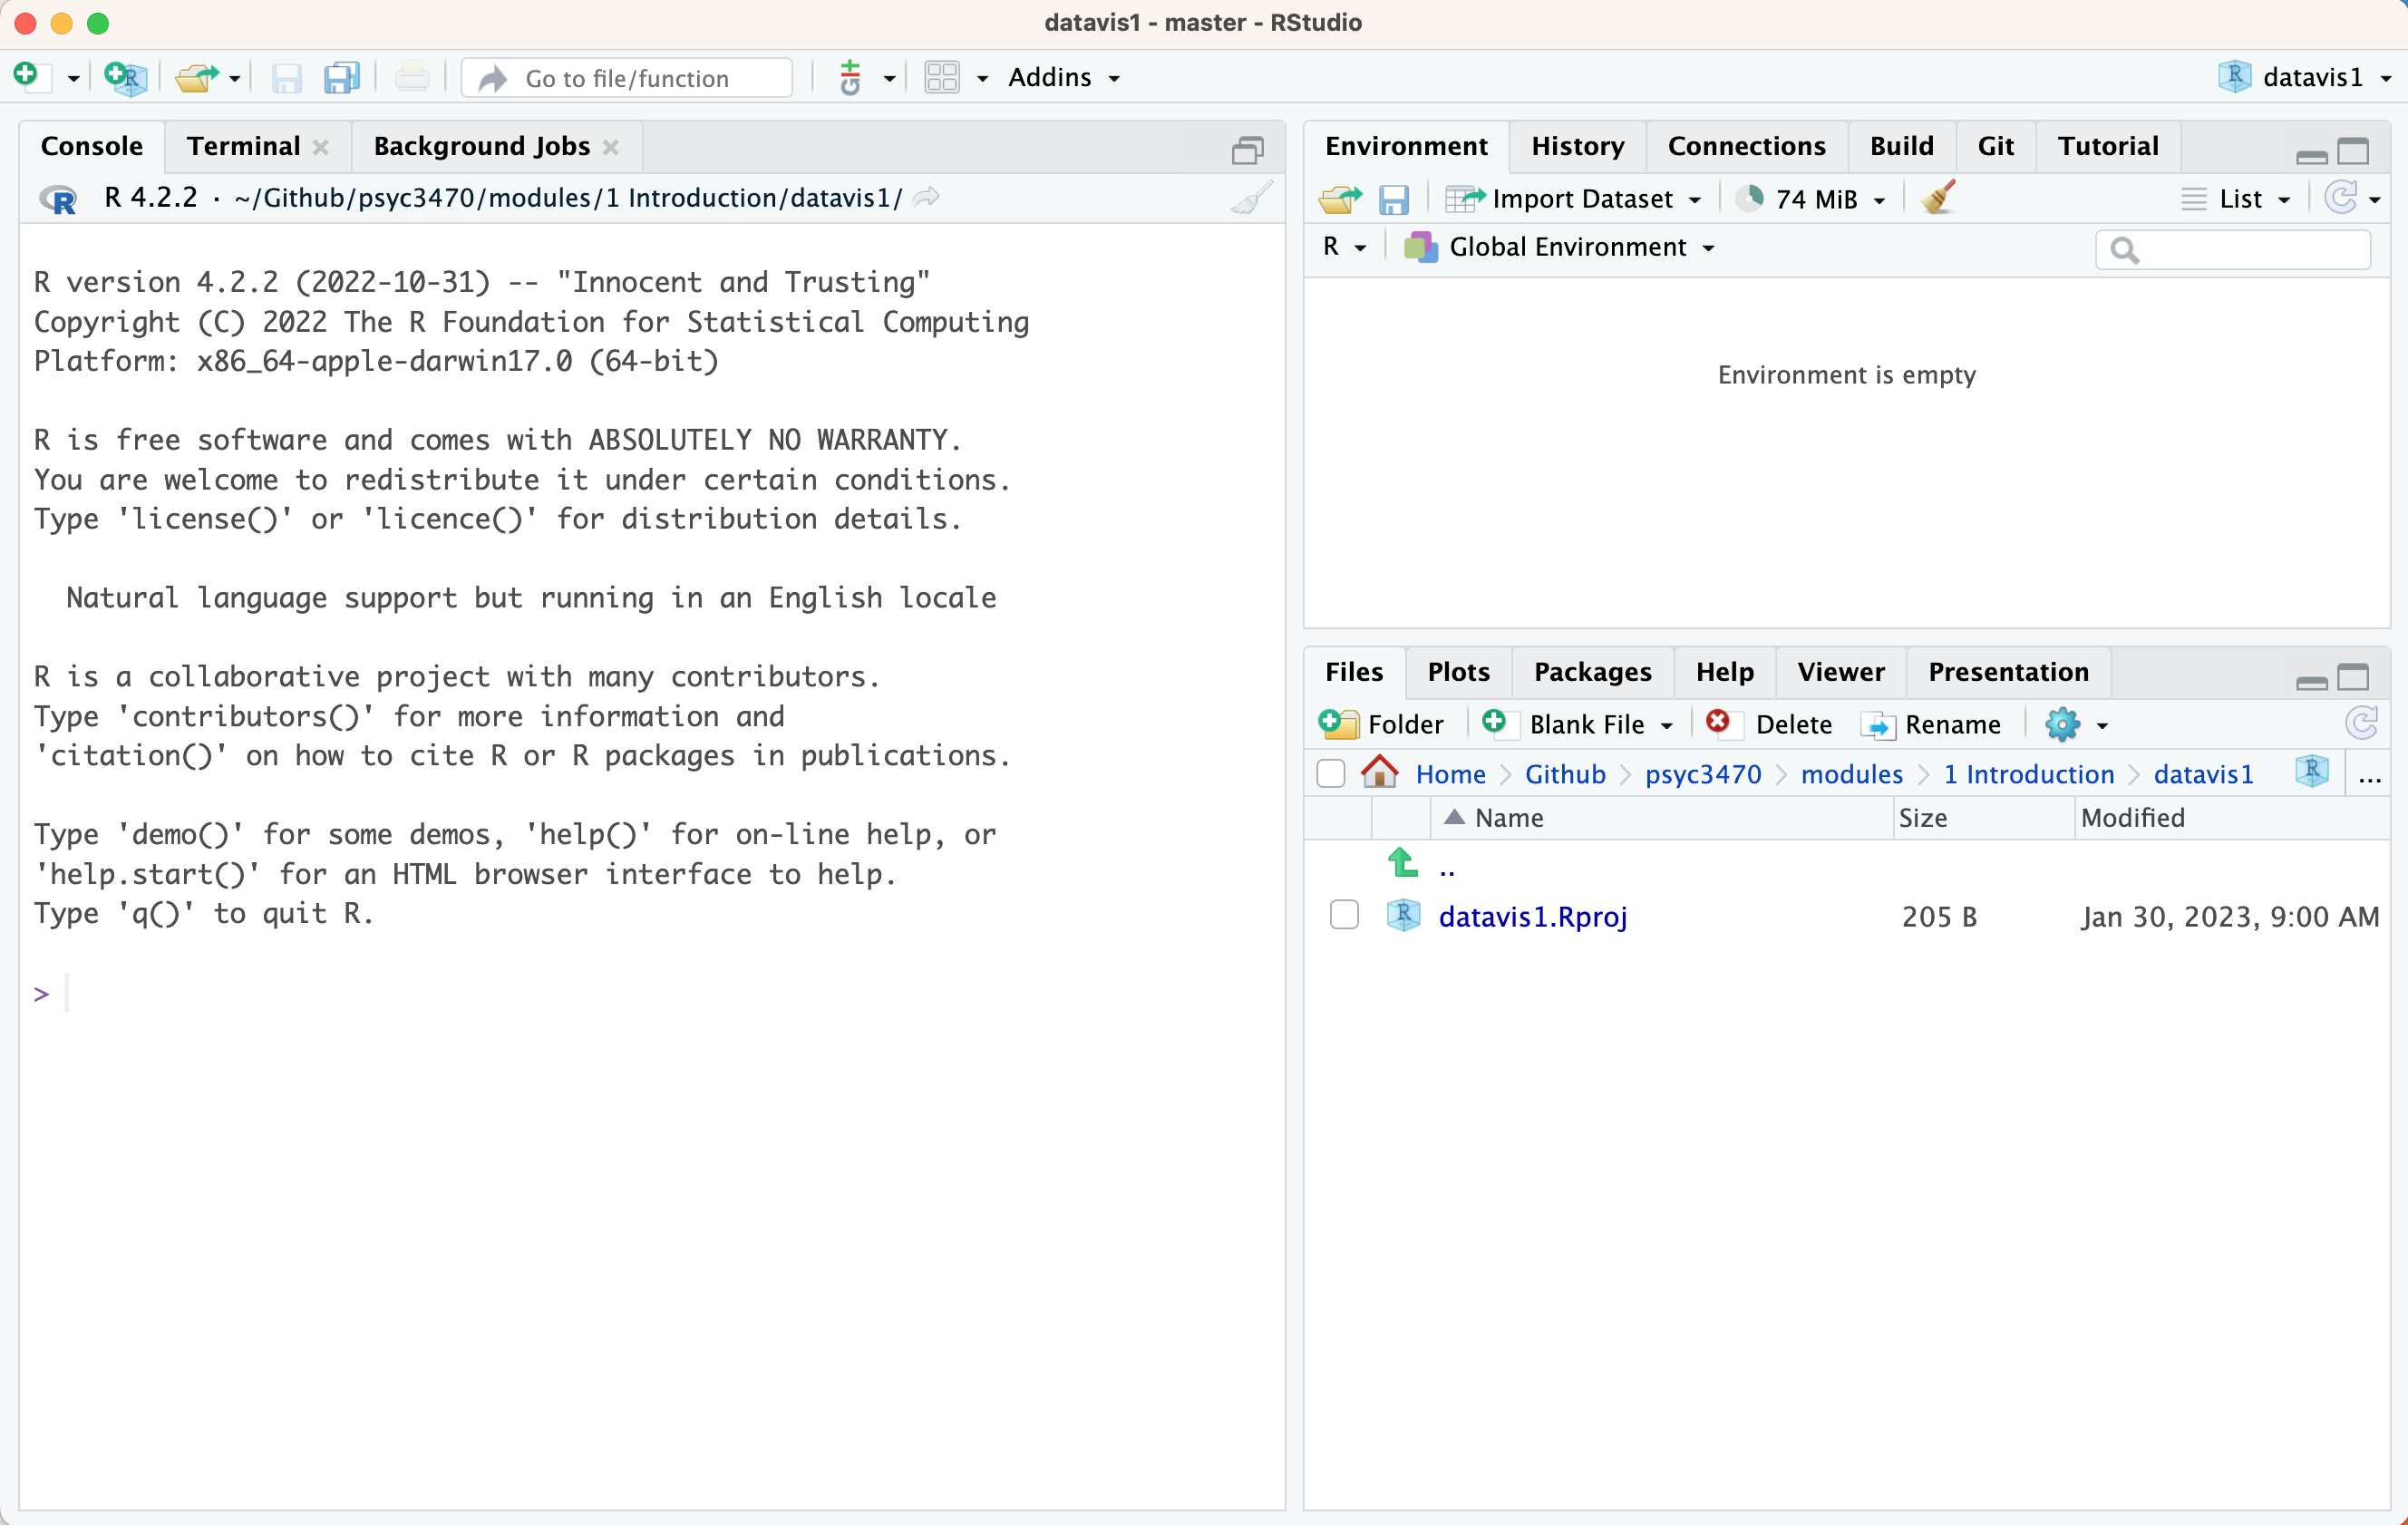
This is what an empty R studio project looks like. The bottom right corner shows you the folder for your current project. There is only one file “datavis1.Rproj”. If you click on this file from your filesystem (e.g., in finder on a mac, or in explorer or my computer on windows), then it will load Rstudio and this project.
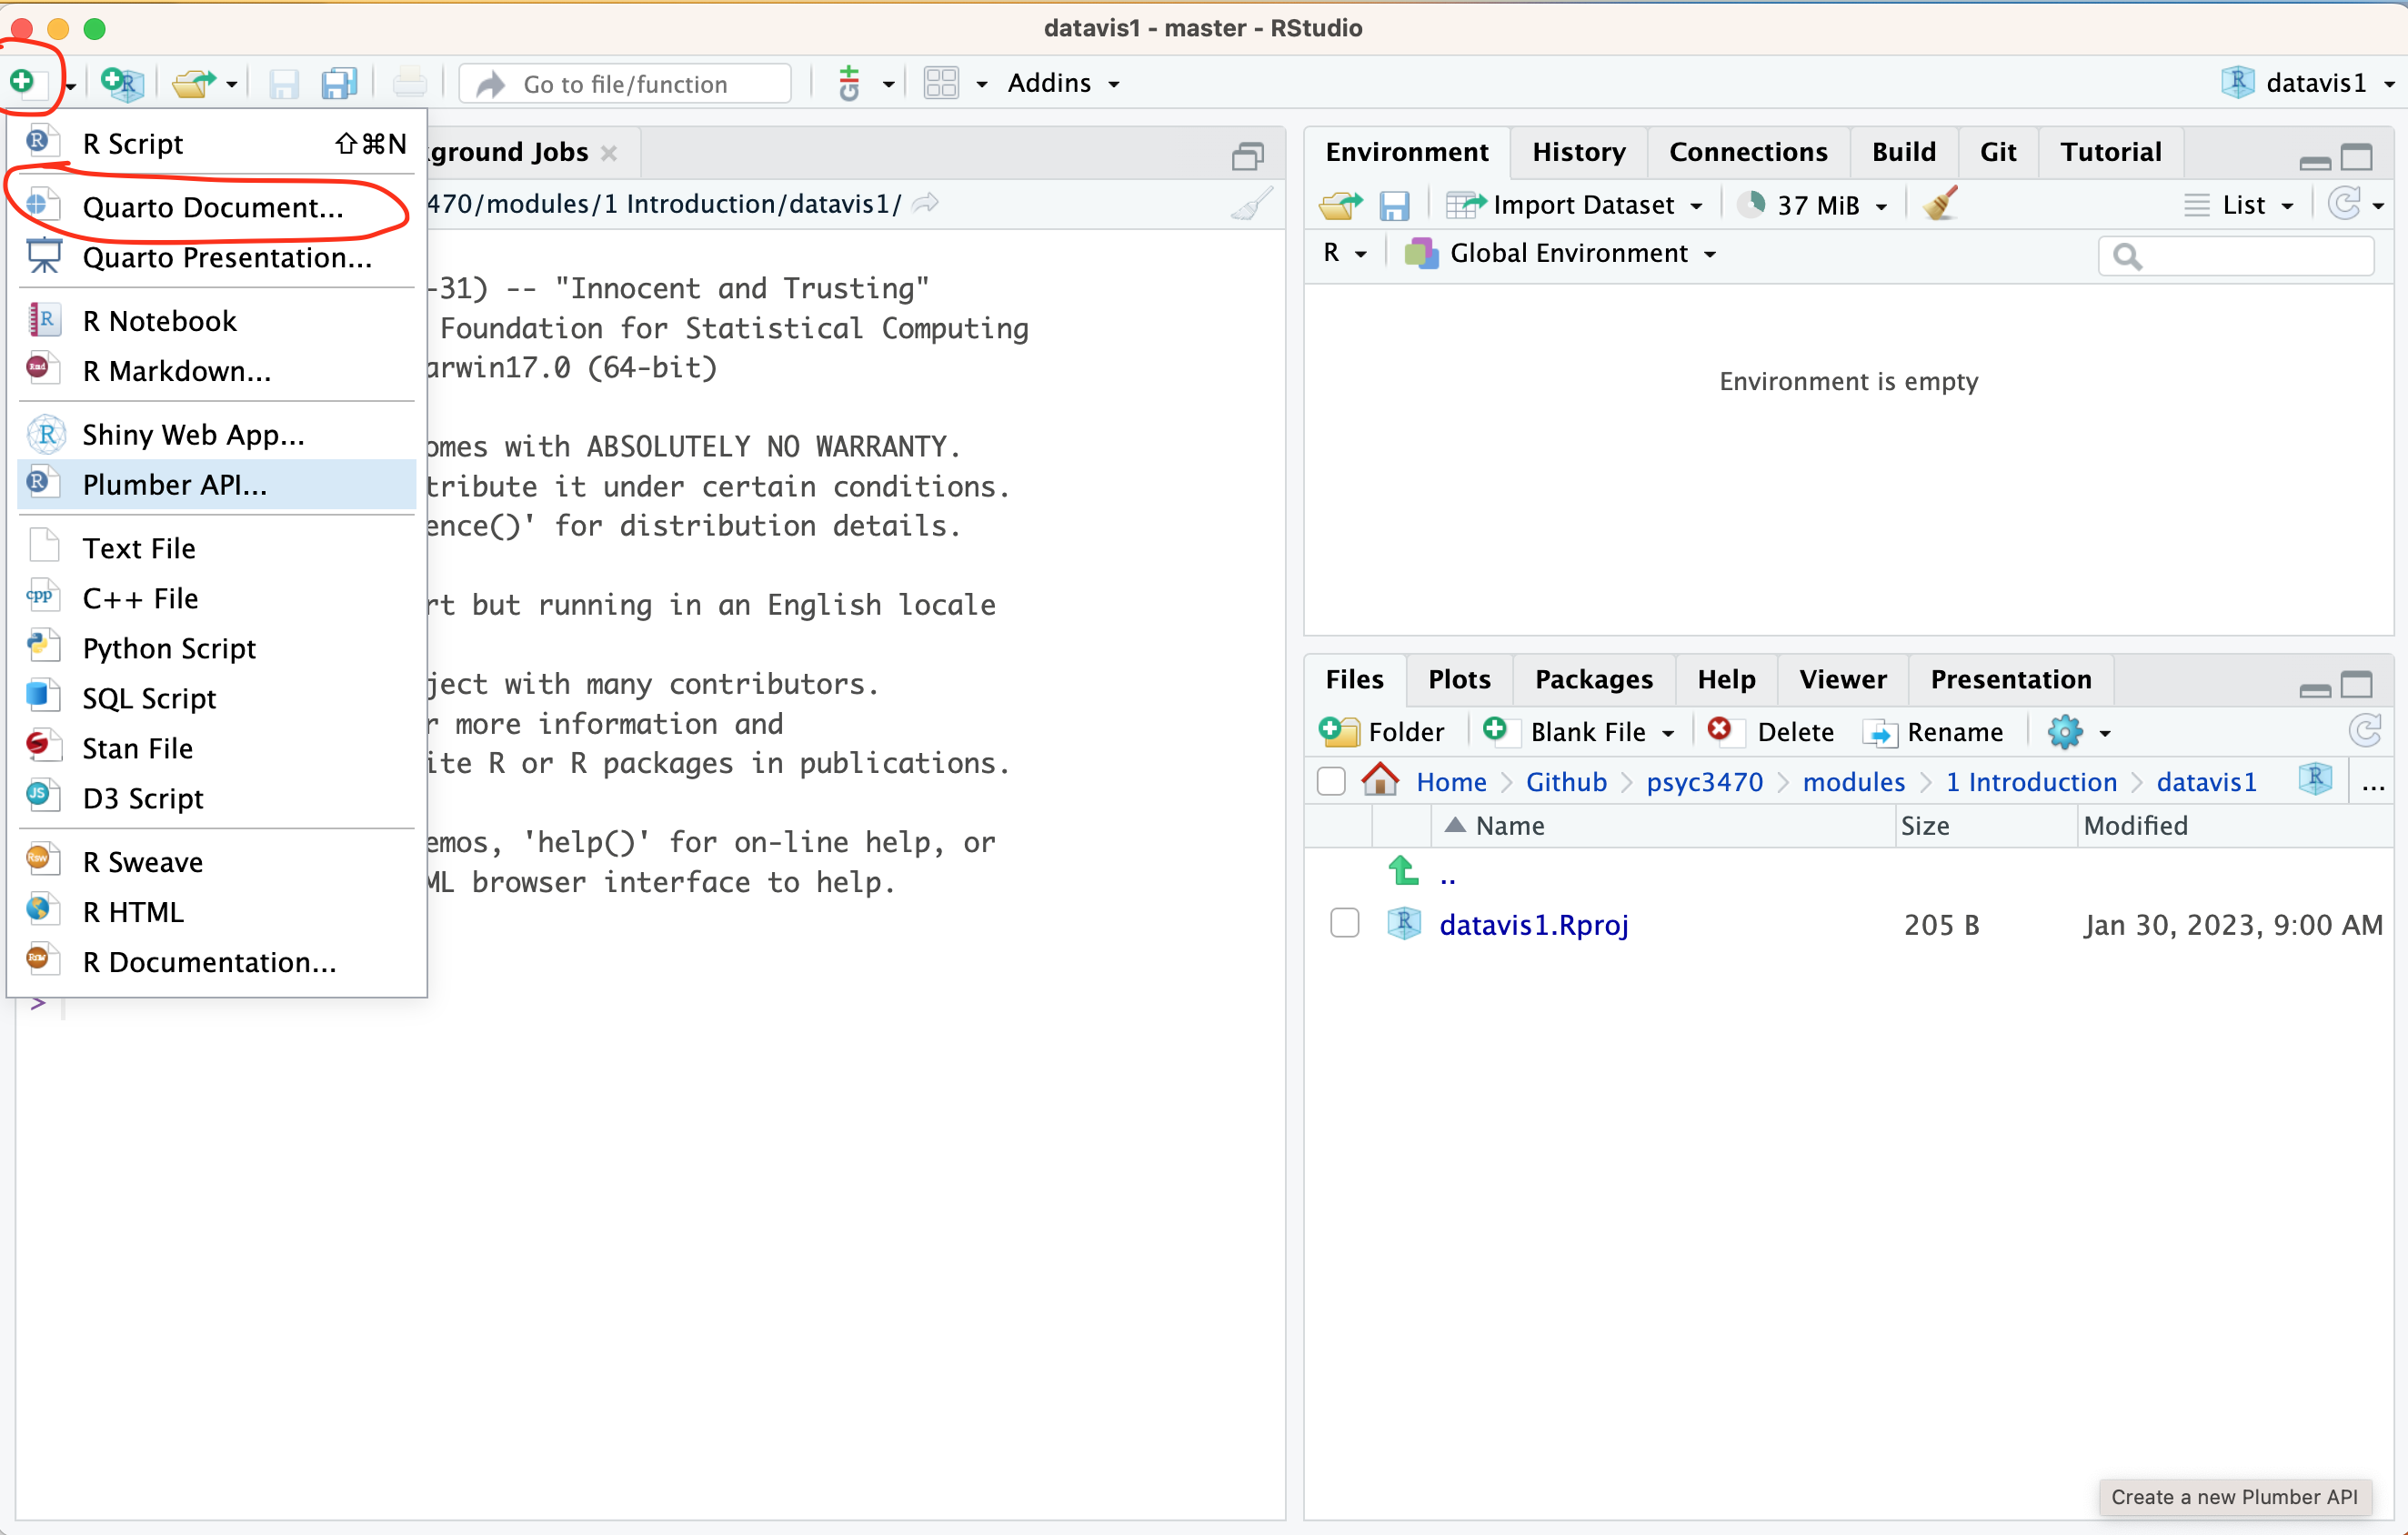
- Create a new quarto document. Click the green circle with a plus, choose new “Quarto document”.
Give your document a title.
- Click the “Render” Button. Then save your document in your R project folder.
- IMPORTANT. The title of your document can be different from the name of the file. You should change the file name from “Untitled.qmd” to something more descriptive like “datavis_example.qmd”, and then press save.
- After saving and rendering the document you will see the html (web-page) output. The file doesn’t have any text or analysis code, so it will appear mostly blank.
The datascience in a box course has an example data analysis and visualization that we should be able to reproduce on our computers.
This example shows a short data-analysis report that conducts a visualization of United Nations voting data for different countries.
The source code for this report is available here:
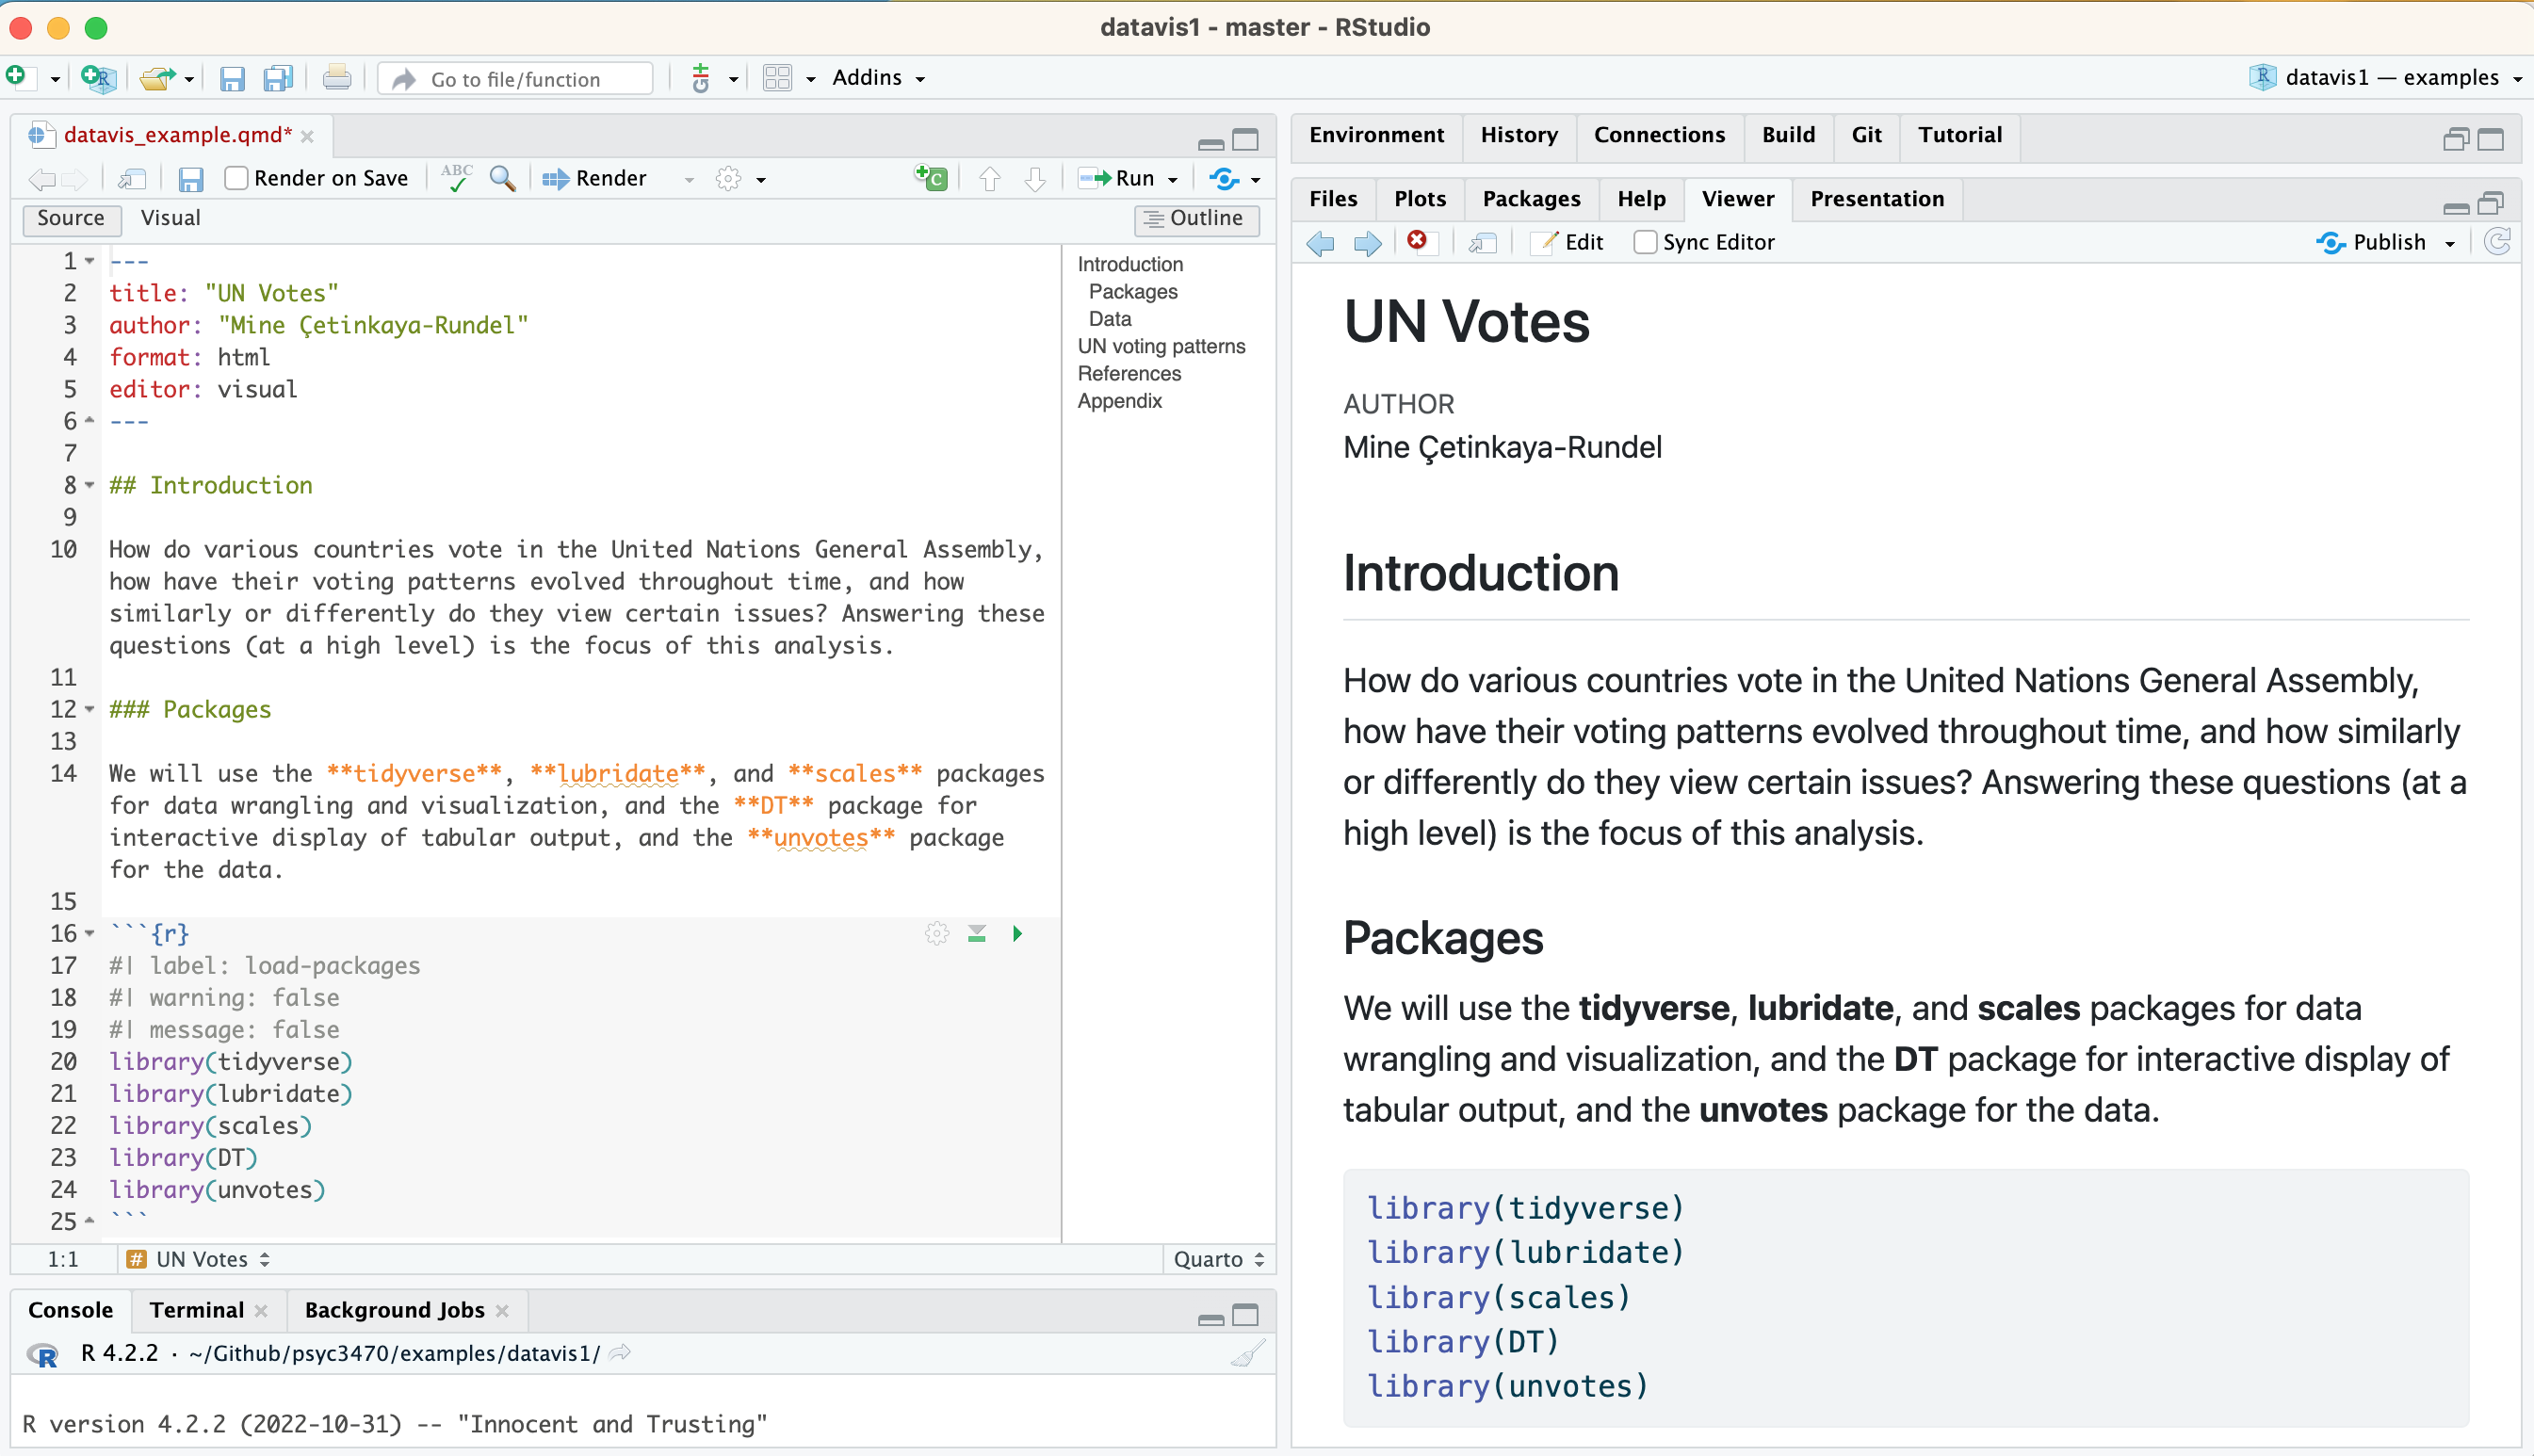
Copy the plain text from line 1 to line 92, and then paste it into your own .qmd document. Make sure you replace all of your original text. Save your .qmd document.
Rstudio may ask you to install some missing packages, click the install option.
Once the packages are installed, then you should be able to render the document. And, you should see something like this.
We are going to cover the rest in class. If you missed class you can try the videos about this content on datascience in a
https://datasciencebox.org/02-hello-world.html
The first two videos are probably most helpful and similar to what we will discuss in class.
Finally, I created a folder called examples in the gihthub repository for this course. This example is located in the “datavis1” folder. You can also download this folder and access its contents as another method to try the example: